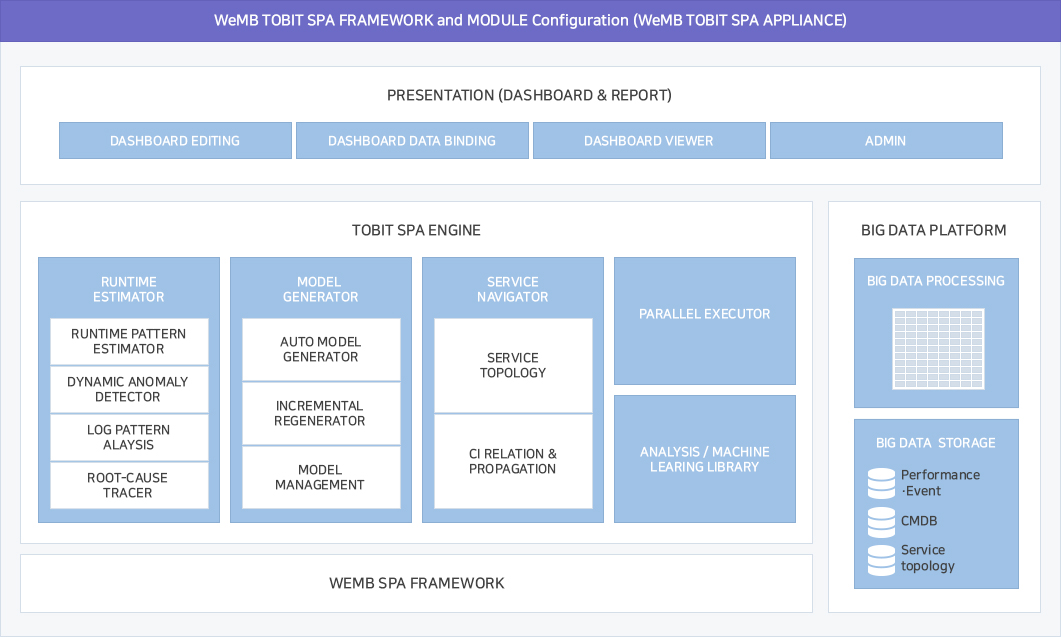

It is a system that studies the data collected from various sources by analyzing algorithms according to the characteristics of data to create a valid model, detects abnormal symptoms in advance, and analyzes the cause.
By providing a flexible integration engine that can be easily applied to the user’s various data occurring in the environment, it minimizes interface latency.
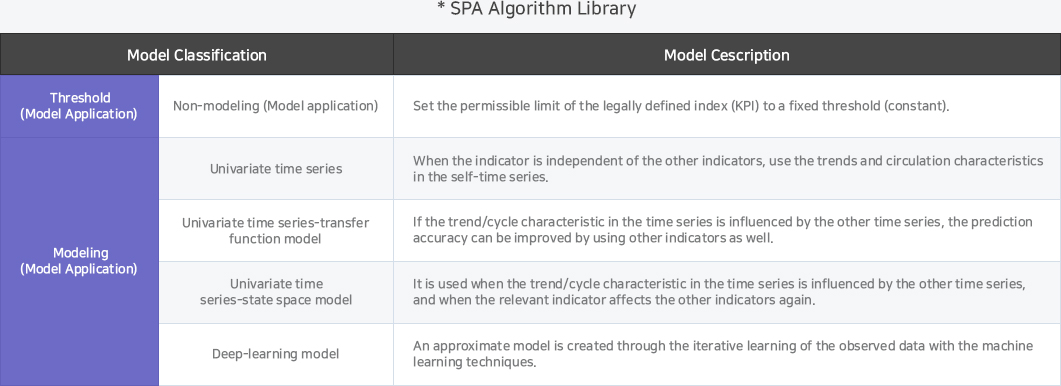
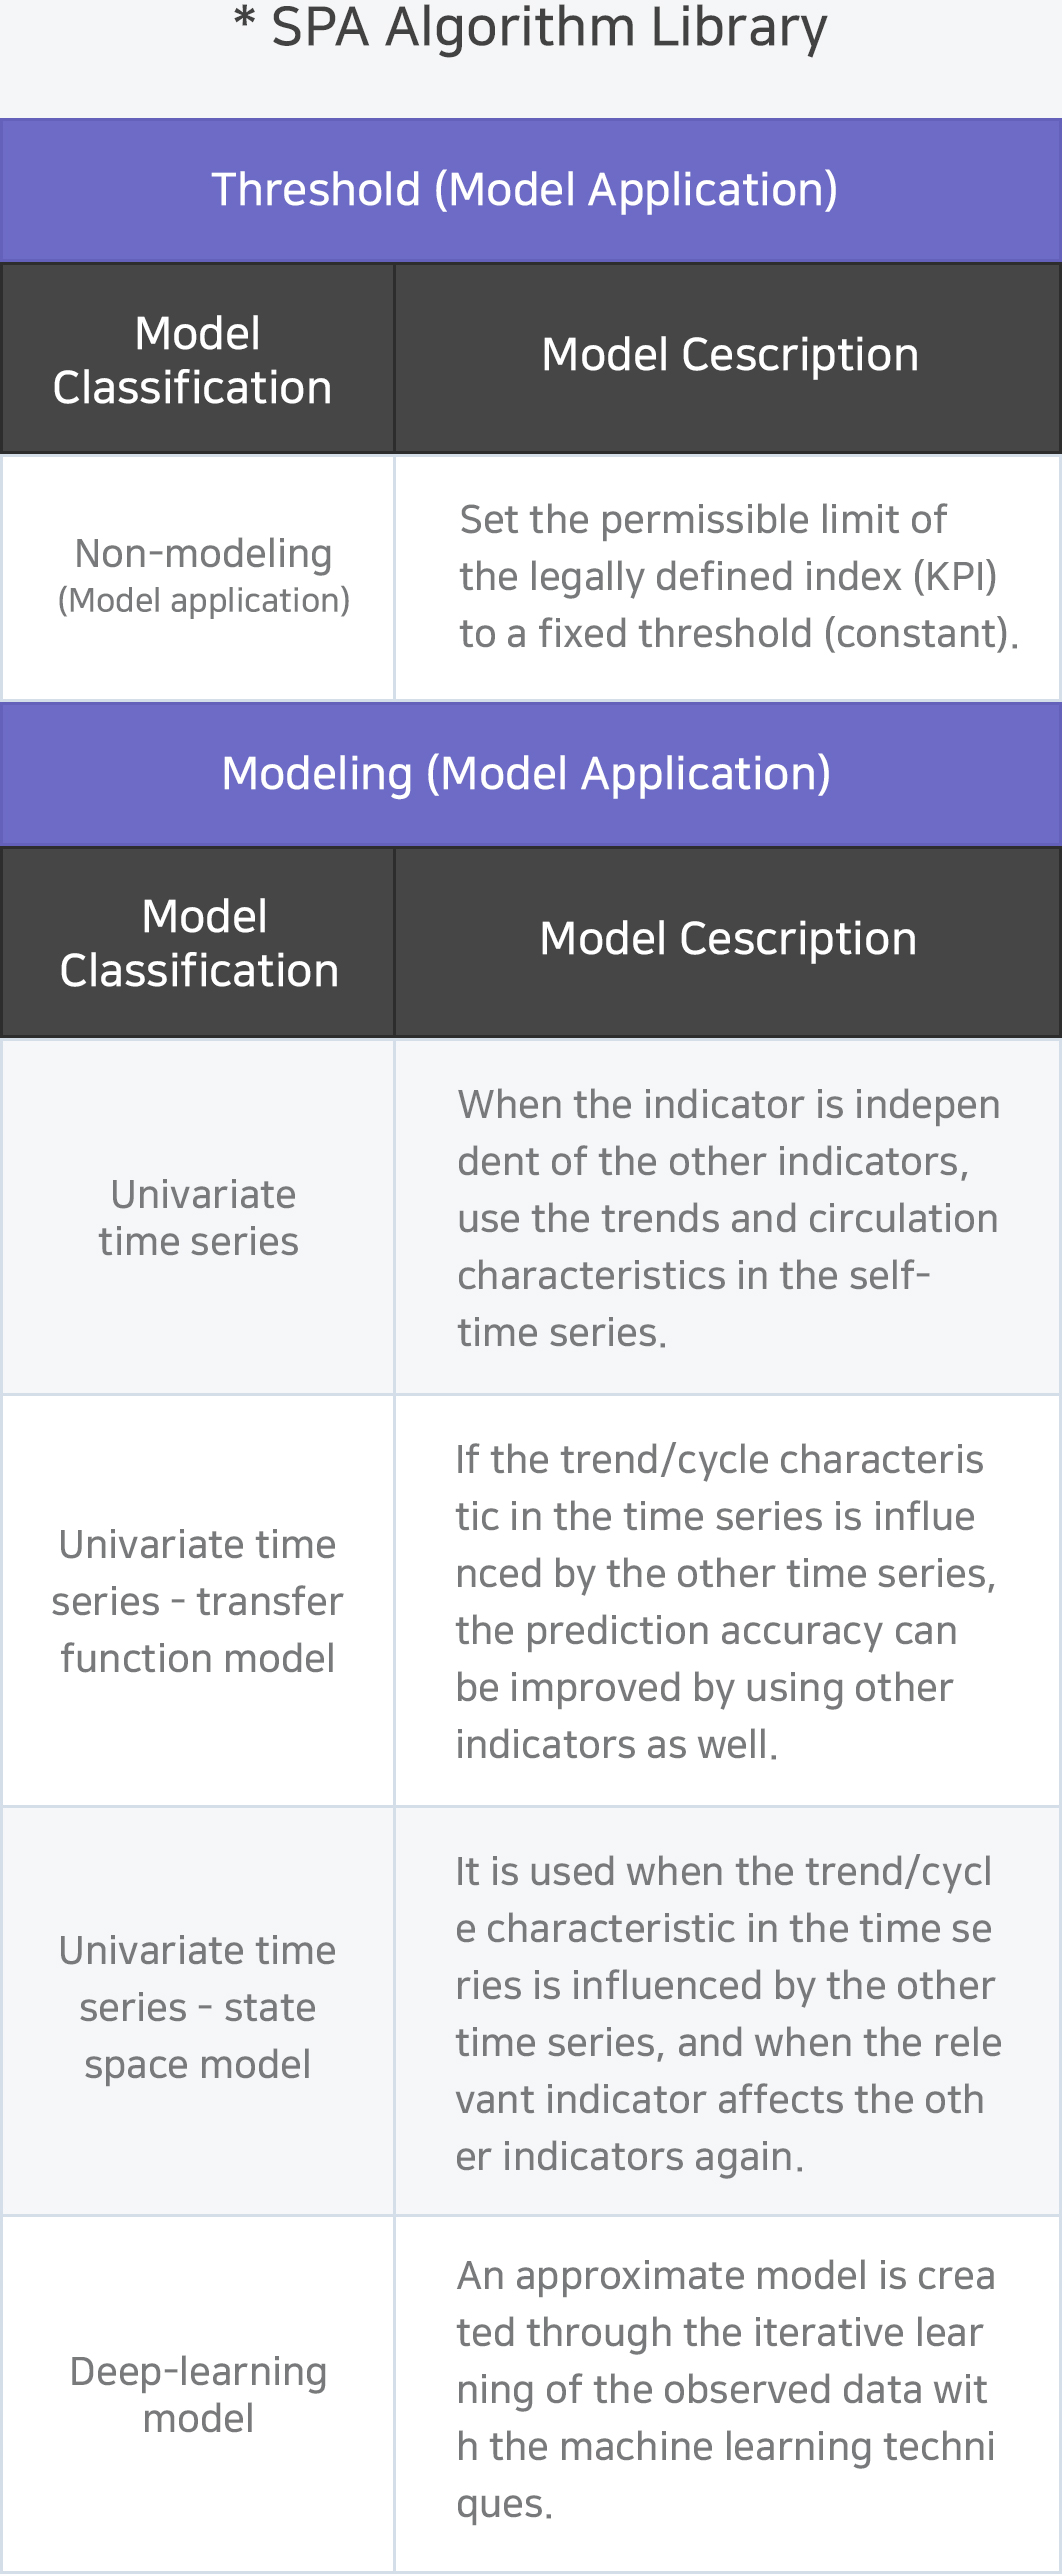
The analysis algorithm that utilizes the finance/public/manufacturing fields’ model is also provided in library format with multiple predictive analyses.

Pre-failure symptom detection based on dynamic thresholds
Failure symptom detection based on statistical modeling
Fast failure and impact analyses based on a topology that links business services and IT resources
Fast failure and impact analyses based on a topology that links business services and IT resources
Organic and flexible management of the failure status and statistical analysis function according to the system equipment, disability type, and disability level
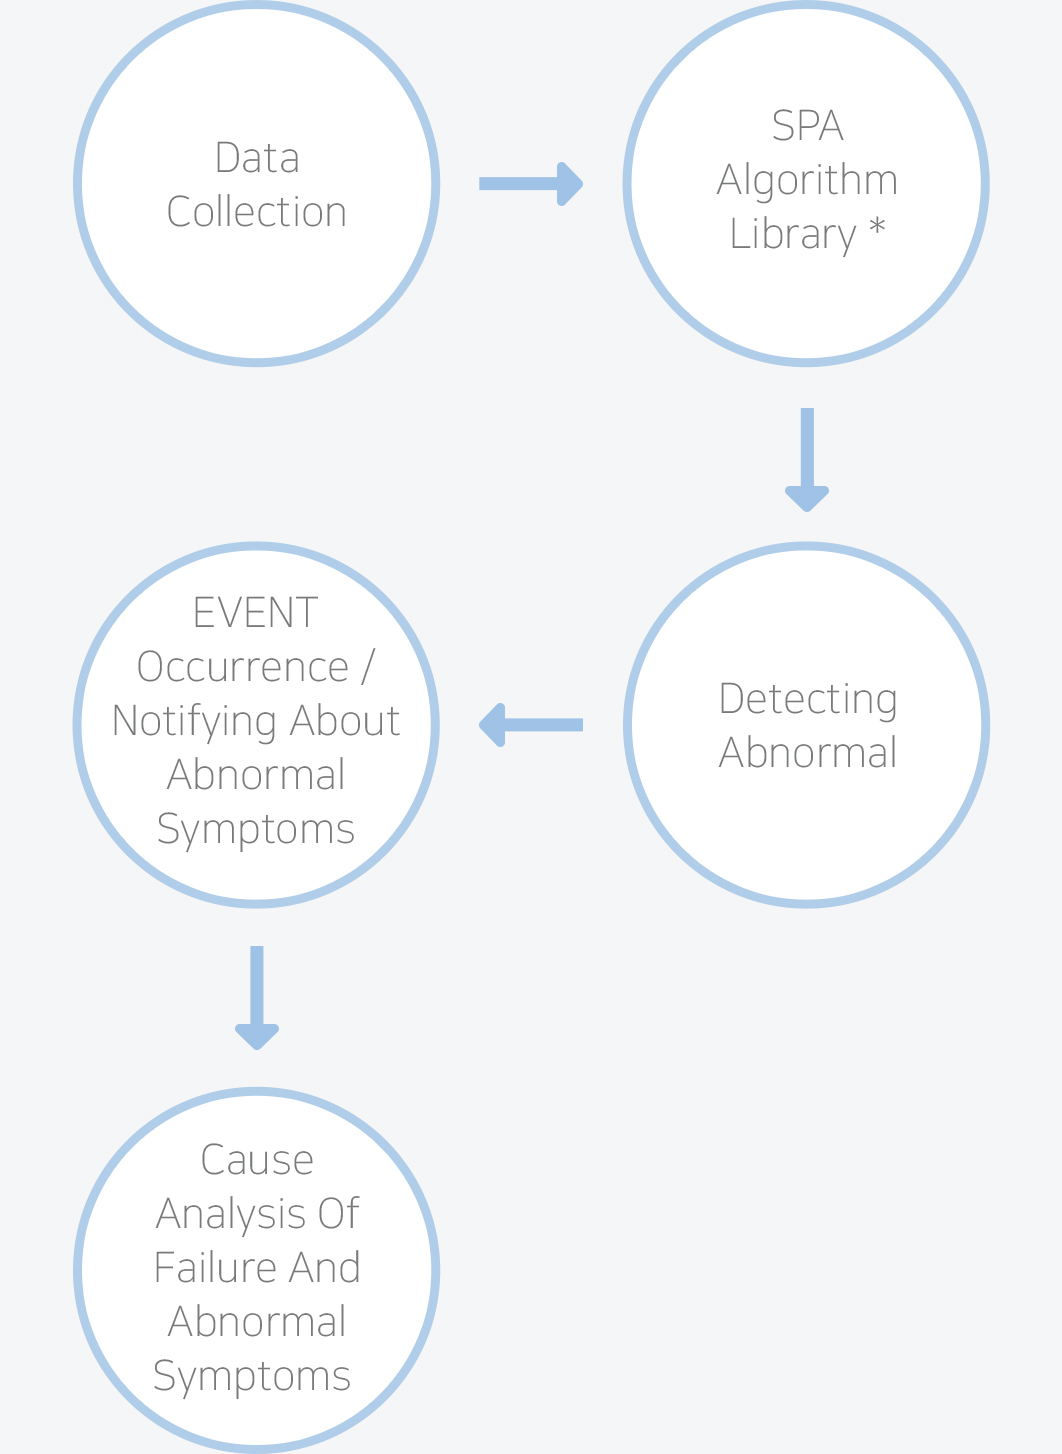
Failure and abnormal symptom detection
Threshold range exceeded/below average
Proactive detection of abnormal symptoms through the statistical technique (algorithm)
Incident occurrence
Detection of an anomaly in advance → EVENT occurrence
Primary-cause analysis of failure and abnormal symptoms
Analyze the cause by linking the IT-resource-related information from the perspective of the business service → TOPOLOGY-based event linkage and filtering
Analysis of similar disorders and abnormal patterns in the past
Analysis of similar failure patterns and analysis using CMDB
Secondary-cause analysis of rfailure and abnormal symptoms
Analyze which services are affected based on the configuration information associations between IT resources from the perspective of the business services.
Establishment of priorities based on the business impact
Solution establishment and processing
A stage where specific measures and activities are executed for problem-solving
Failure is resolved, and the action history is managed.
Actualizing the failure index and statistic model by analyzing the failure outcome
Supporting the virtuous-cycle structure with the efficient actualization of the statistics model in the operation process
Secondary-cause analysis of failure and abnormal symptoms
Analyze which services are affected based on the configuration information associations between IT resources from the perspective of the business services.
Establishment of priorities based on the business impact
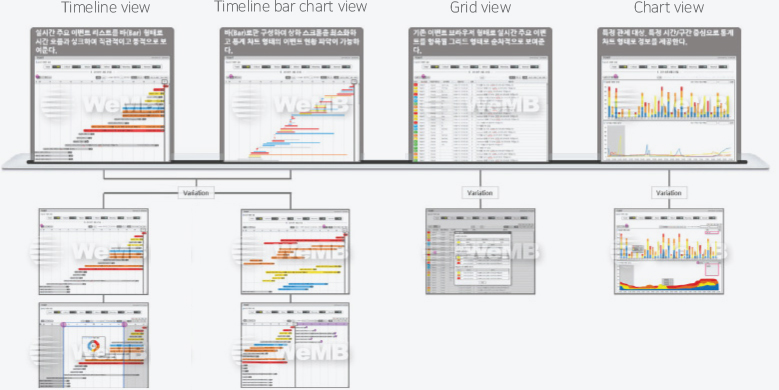
Providing the screen to link from the enhancement of the efficiency in big-data meaning interpretation and failure detection to the failure cause identification and cause analysis
* The greatest value of a picture is when it forces us to notice what we never expect to see. – John Tukey, creator of exploratory data analysis
Various explorations
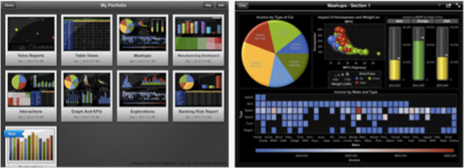
Advancement analysis
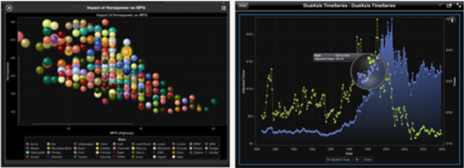
A function that searches all the events of the set time interval (including specific information) sequentially according to the set sorting information and the impact analysis results of the configured items by time and priority
